Electronic Skin
The electronic skin page is used to connect tactile sensors, view pressure data in real time, and record collection tasks.
Dashboard
The dashboard is used to view real-time electronic skin data and perform collection recording:
- Supports scanning serial ports and selecting the current electronic skin device.
- Supports connecting and reconnecting.
- Supports entering a task name / file name to save the collected data.
- Supports starting a recording, and interrupting and deleting the current task when needed.
- Supports manual zeroing to reduce the impact of the initial pressure offset on data observation.
The dashboard provides two pressure visualization methods:
- 3D Pressure Ridge Plot: Displays the pressure changes of different contact points as a three-dimensional surface.
- XY Matrix Plot: Displays the contact point distribution and pressure changes as a matrix heatmap.
The total pressure line chart on the right shows the real-time total pressure value of the electronic skin, making it easy to observe the process of contact, pressing, and releasing.
Data History
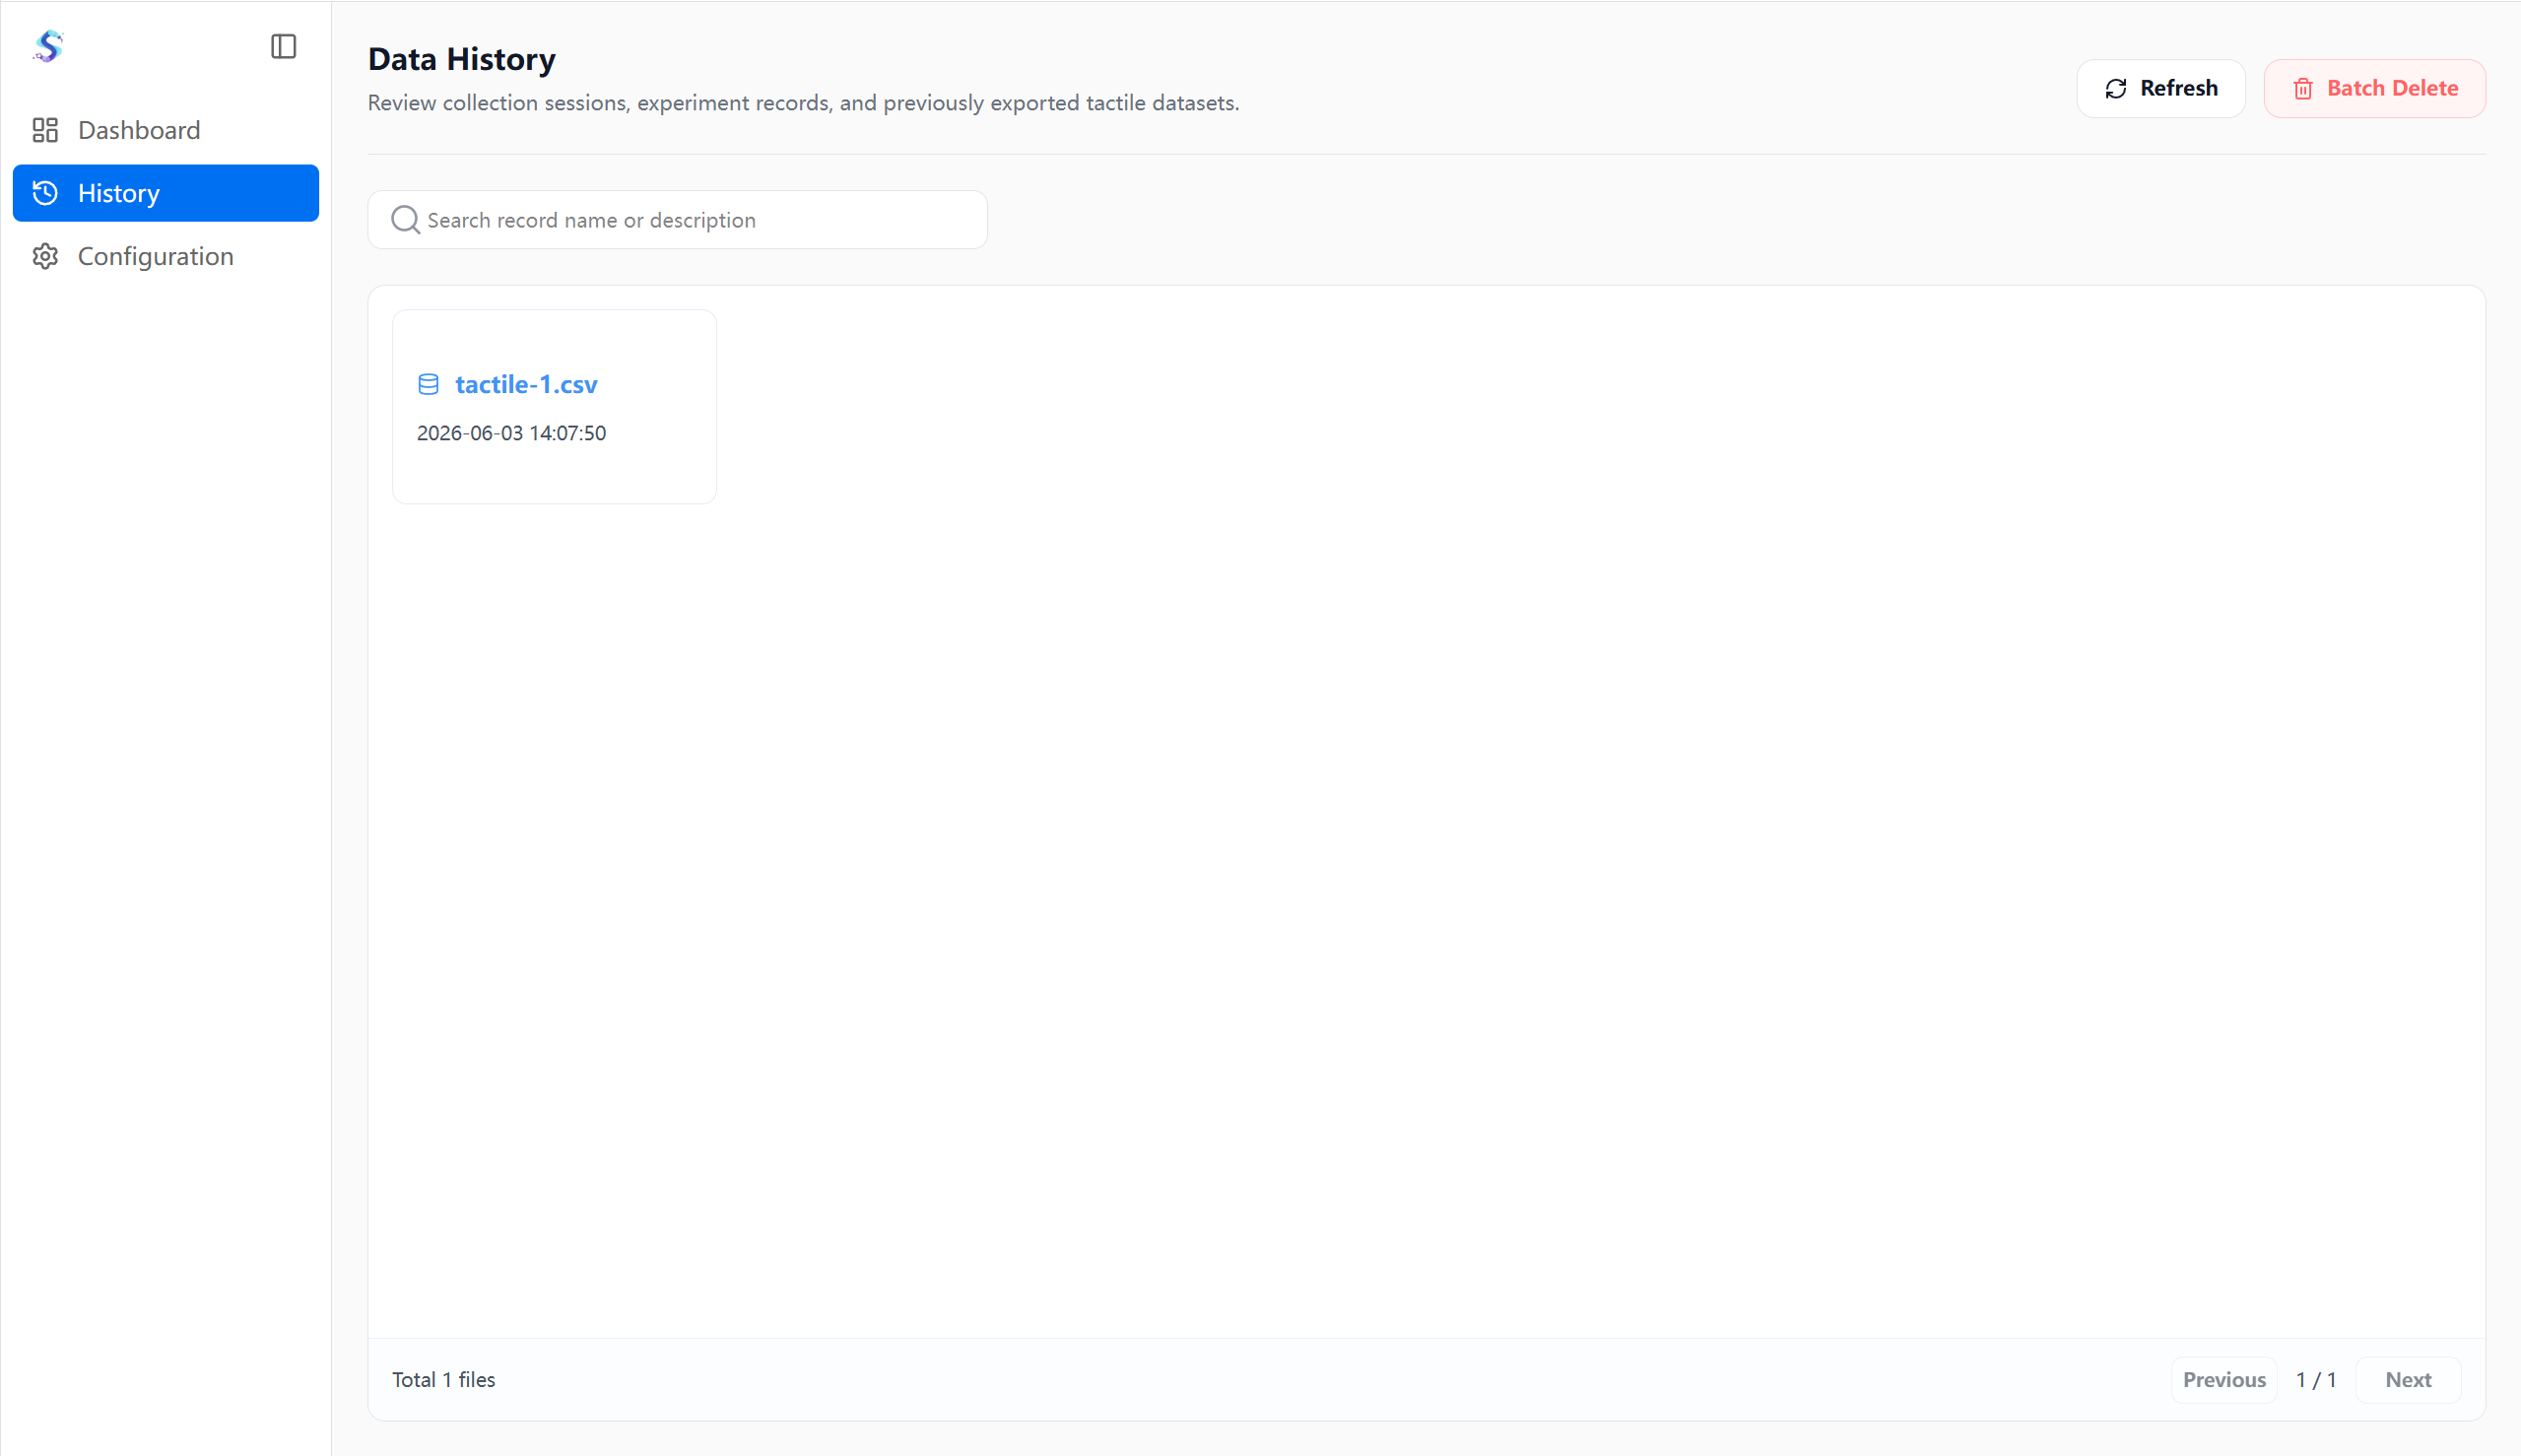
The data history page is used to view saved electronic skin collection records:
- Supports searching by record file name.
- Supports refreshing the record list.
- Supports deleting a single record or deleting in batch.
- Displays the record name and collection time, making it easy to trace experiment segments.
After clicking a history record, you can enter playback mode to view the data from that collection.
Playback Mode
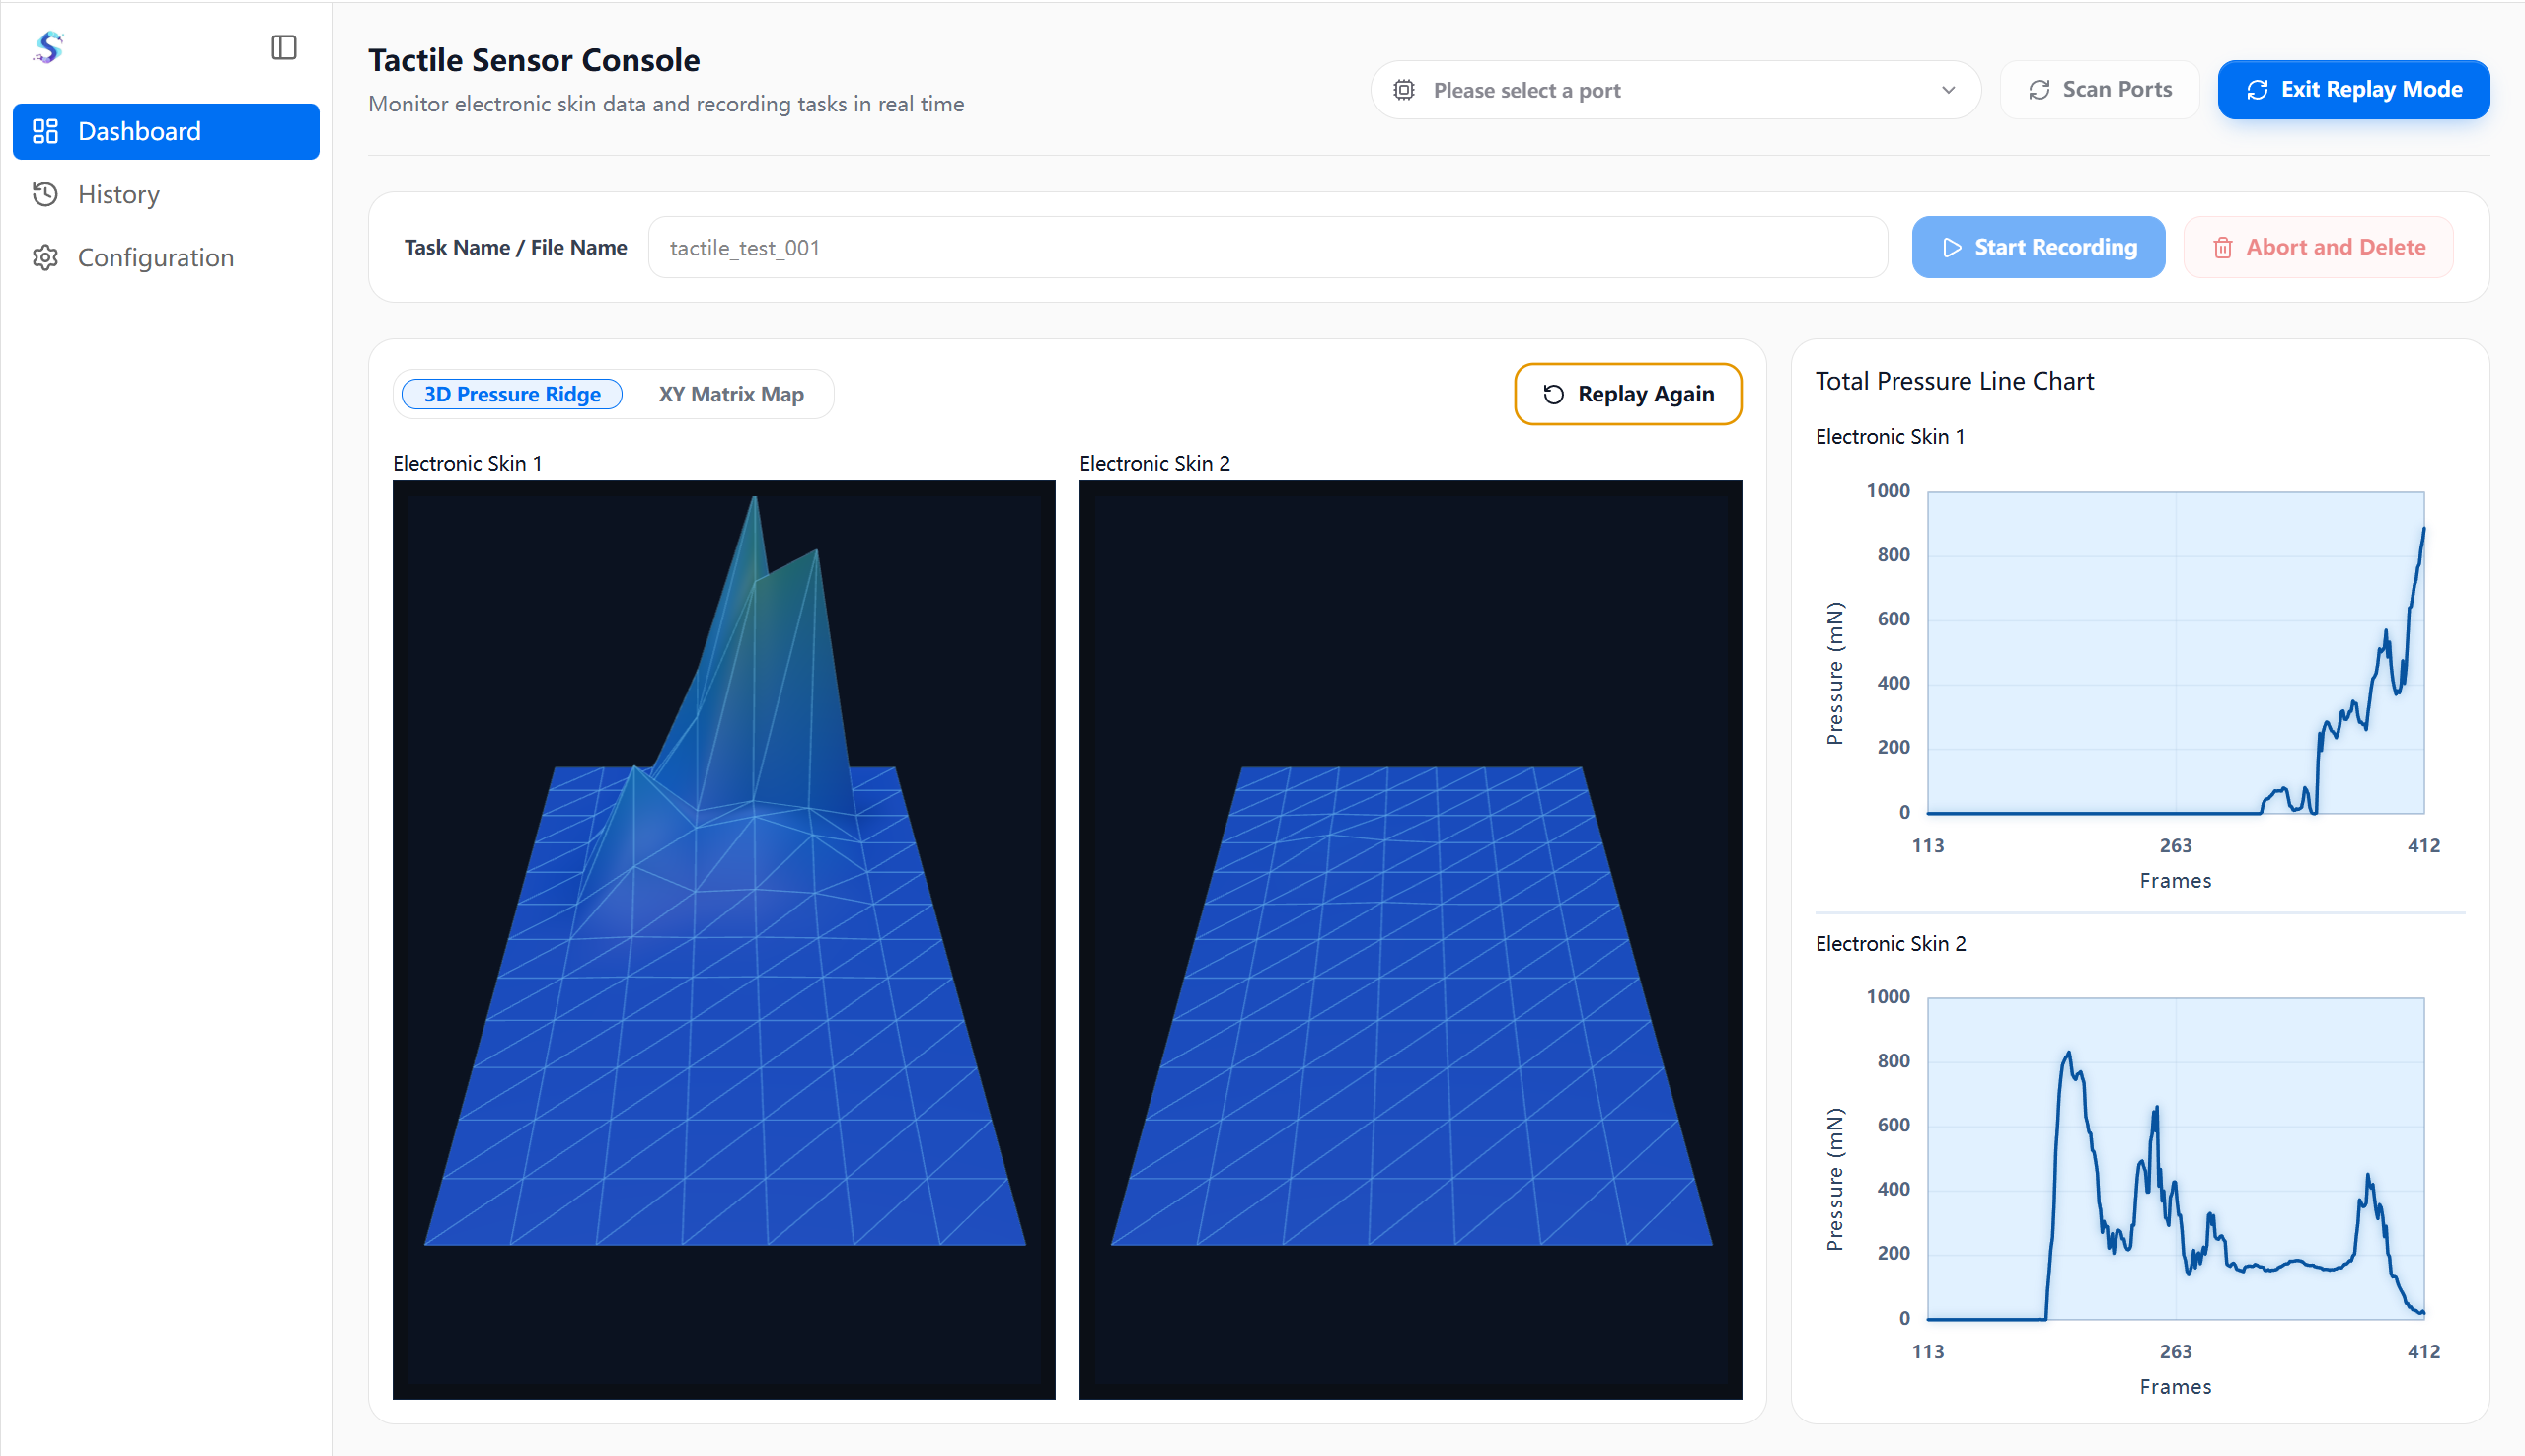
After entering playback mode from the data history, the page reproduces the pressure changes during collection:
- You can switch between the 3D pressure ridge plot and the XY matrix plot.
- Supports replaying the historical data.
- The total pressure line chart on the right synchronously shows the total pressure change of each electronic skin.
- During playback, you can continue to view the task name, pressure distribution, and pressure curve.
- After clicking Exit Playback Mode, you leave the current playback page and return to the data history page.
Configuration Display
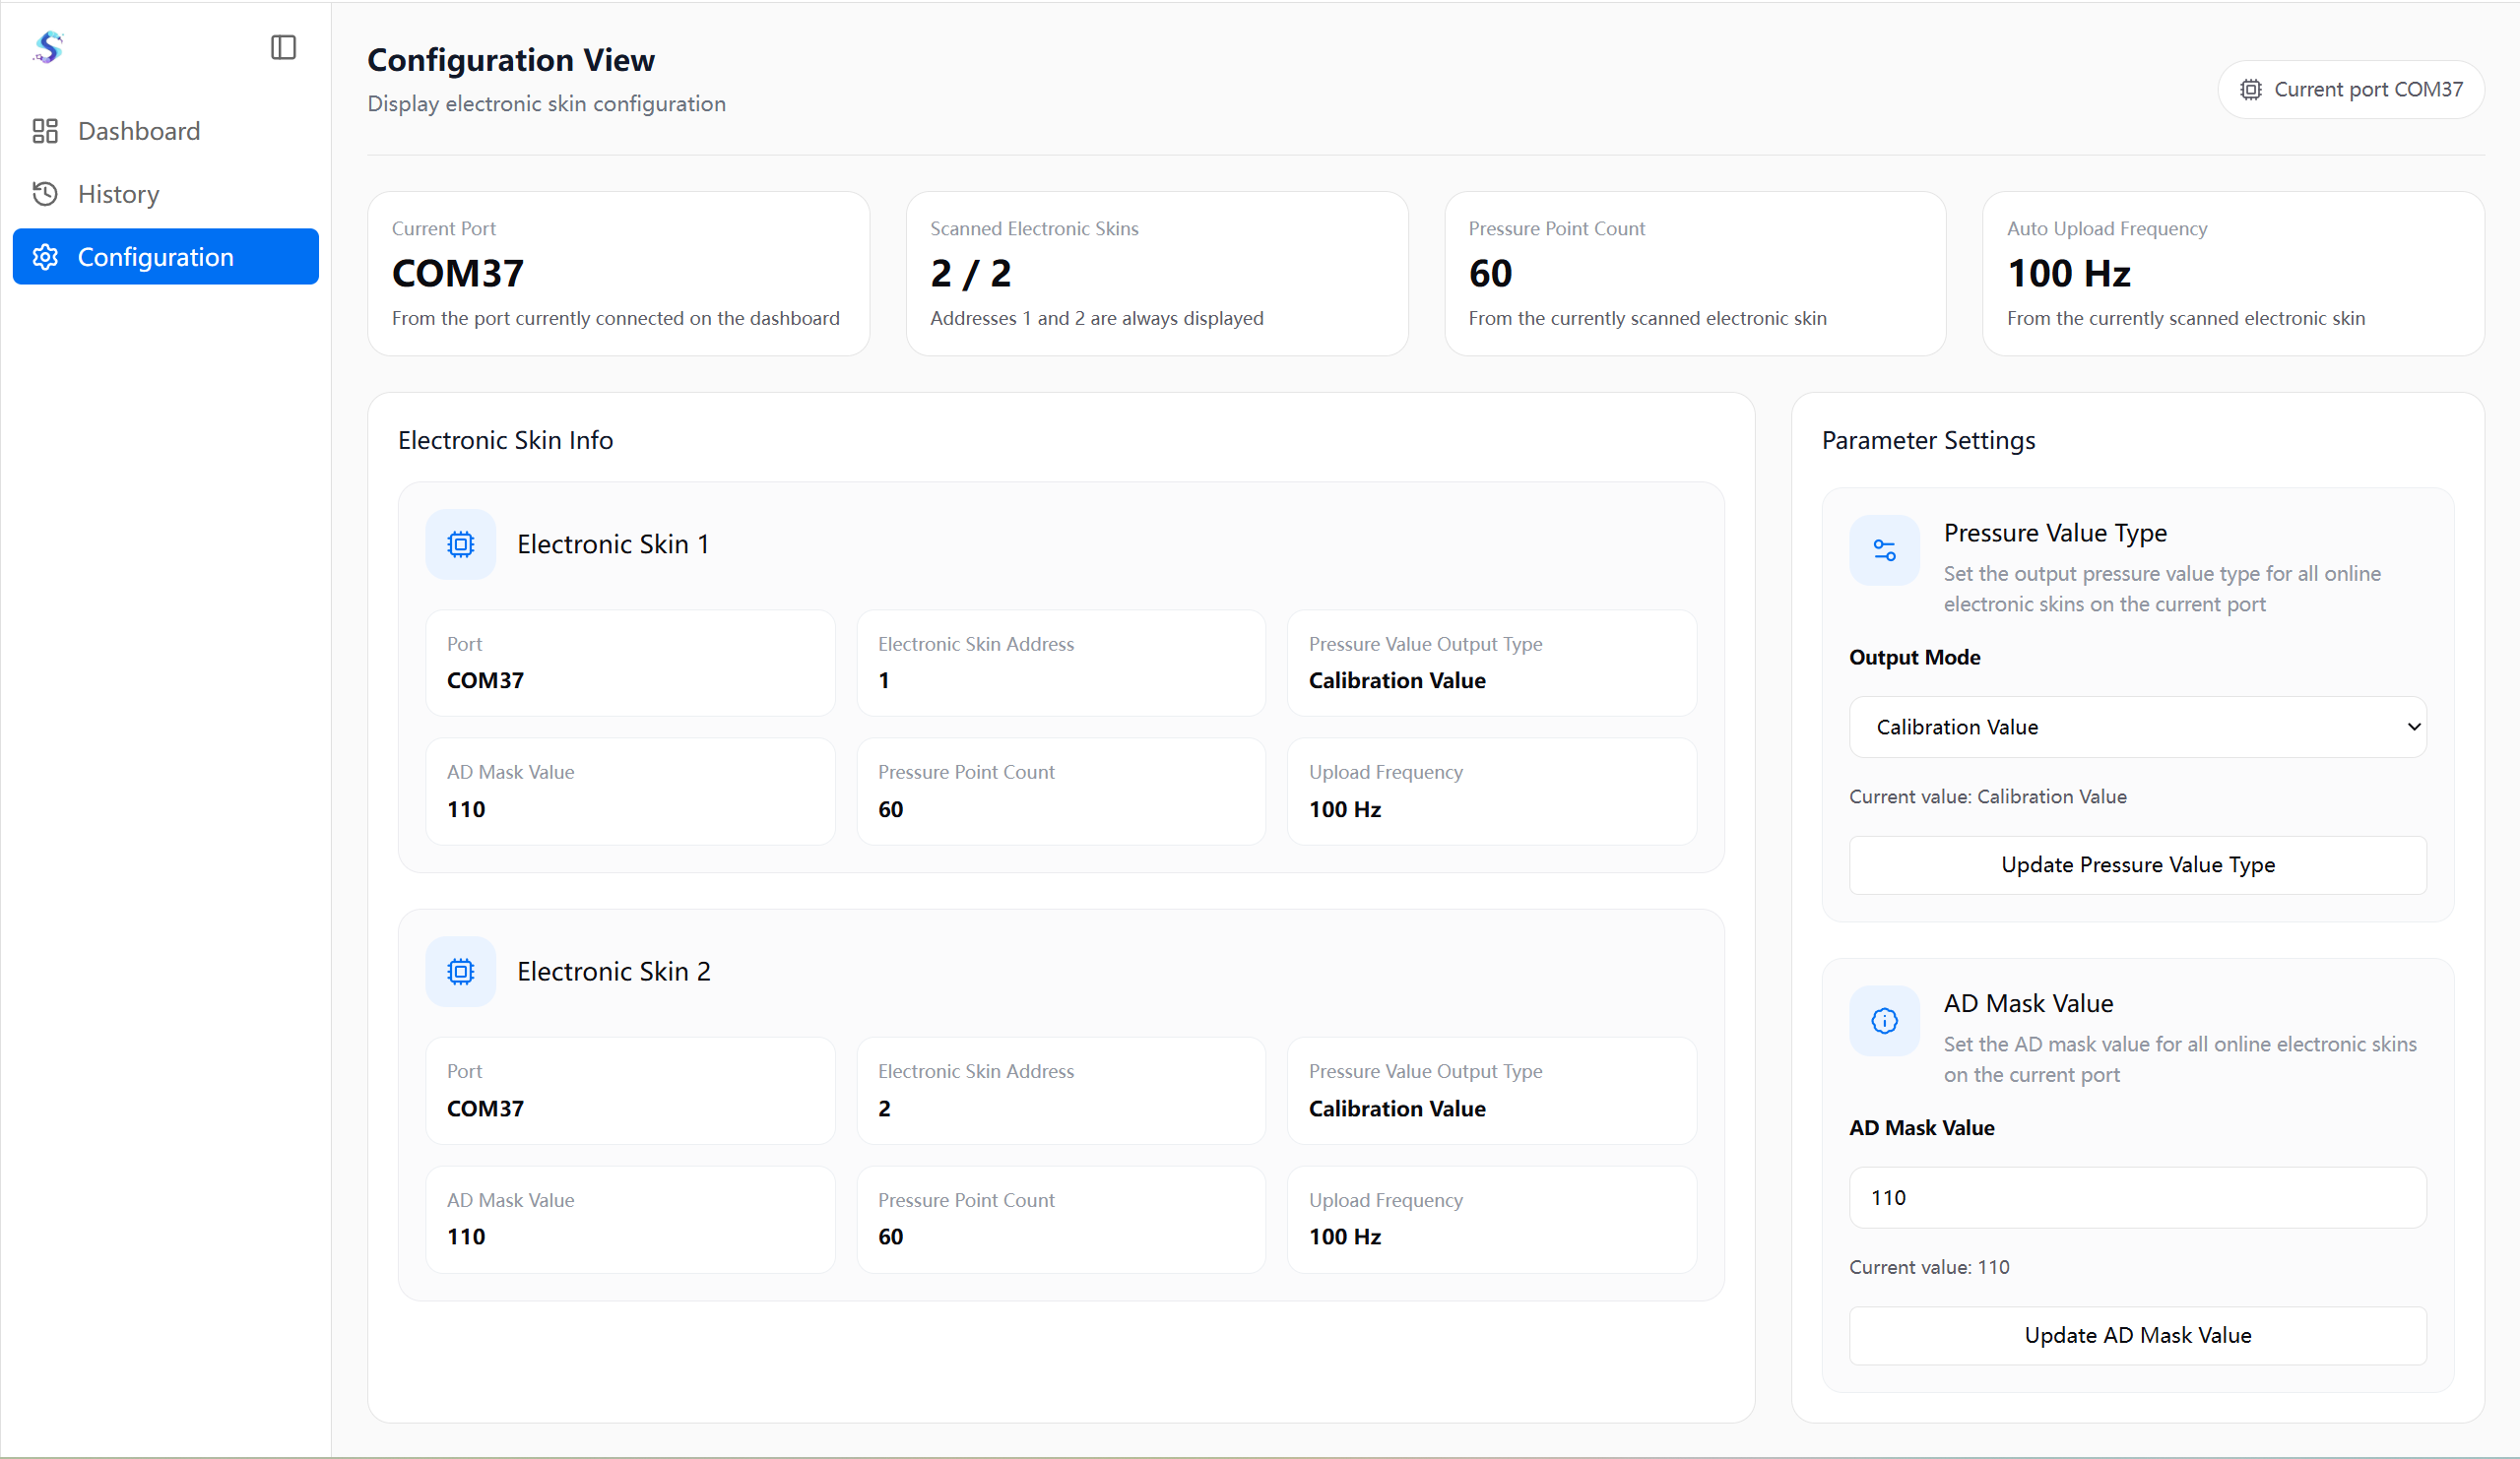
The configuration display page is used to view the current electronic skin connection and parameter information:
- Displays the current serial port, the number of scanned electronic skins, the number of pressure points, and the automatic upload frequency.
- Shows each electronic skin's address, pressure value output type, AD mask value, number of pressure points, and upload frequency.
- Supports updating the pressure value type.
- Supports updating the AD mask value.